
Notes and Sketches from Making SCOTUS Network Visualizations
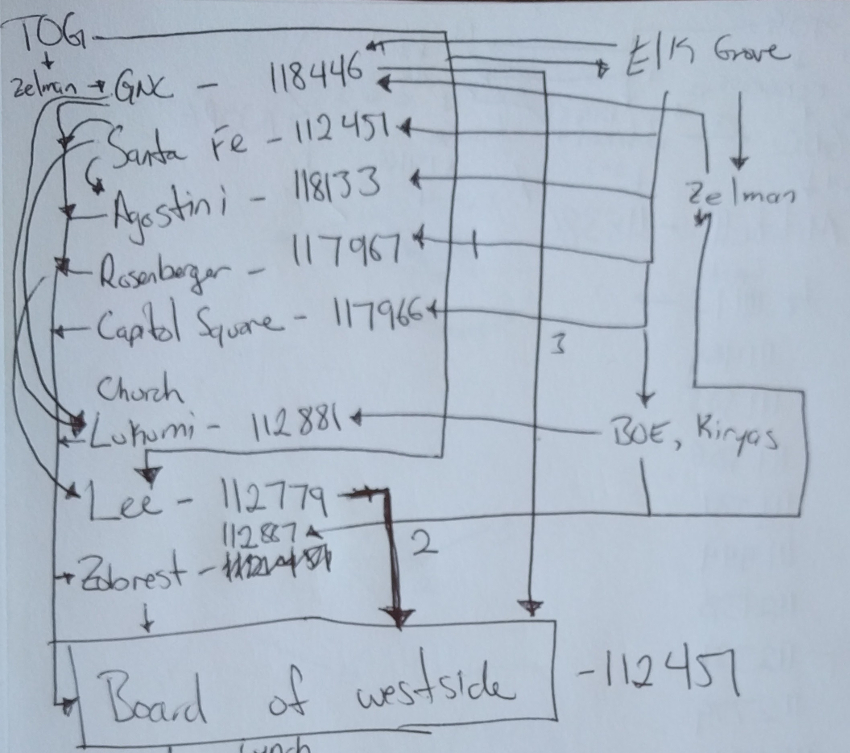
A sketch showing links between cases (click for enlarged view)
In February we announced our Supreme Court Citation Network tool that we developed with University of Baltimore School of Law. We haven't had a chance until now to comment on some of the technical difficulties that came up while we were working on it. If you're not familiar with this tool, you should take a moment now to go check it out (gallery, homepage).
In this post I'll be talking about the challenges that we overcame in order to efficiently generate these visualizations. If you like what you read here, you might want to vote (hint, hint) for Colin Starger's talk at the Cali Conference.
In the Beginning…
A goal at the start was to create a system that could quickly generate these diagrams in response to a user's request, without resorting to any kind of "please wait" mechanism such as a spinner () or any other tricks that might frustrate our users. This would turn out to be a very difficult goal beacuse of the nature of citation networks.
In a database like ours, the data is organized into tables, much like in an Excel Spreadsheet. One such table simply has two columns, which say that Opinion A (in column 1) cites Opinion B (in column 2). This table currently has about 25 million rows. Most opinions have about 30 rows in this table, with each row representing another citation from Opinion A to Opinion B or C or D.
For example:
| Citing Opinion | Cited Opinion |
|---|---|
| Roe v. Wade | Terry v. Ohio |
| Roe v. Wade | Katz v. U.S. |
| Roe v. Wade | Younger v. Harris |
Roe cites Terry, Katz and Younger
With our data this way, when we want to make a citation network, we start at the newest recent opinion in column 1, then look up all of the opinions that it cites in column 2. That will return about 30 opinions that were cited by the newest opinion, and for each of those 30 opinions, we do the same thing: Look up all the opinions that it cites. And for each of those, the same, and so forth until we arrive at the oldest opinion.
What should quickly become clear is that the first lookup will return about 30 results, but the next will return about 900 (30 × 30, because you're looking up all the opinions that all of the first 30 opinions cite). The next hop out from there will contain about 2,700 opinions (again, 30 × 900). This means that to build a network with just a few degrees of separation, we're now in the position of doing about 3,600 queries on our database.
This is bad. When a user can trigger thousands of queries to your database, you know something is wrong. Indeed, when we launched the first version of our citation builder, it took upwards of 10 minutes to generate a graph.
That wouldn't do.
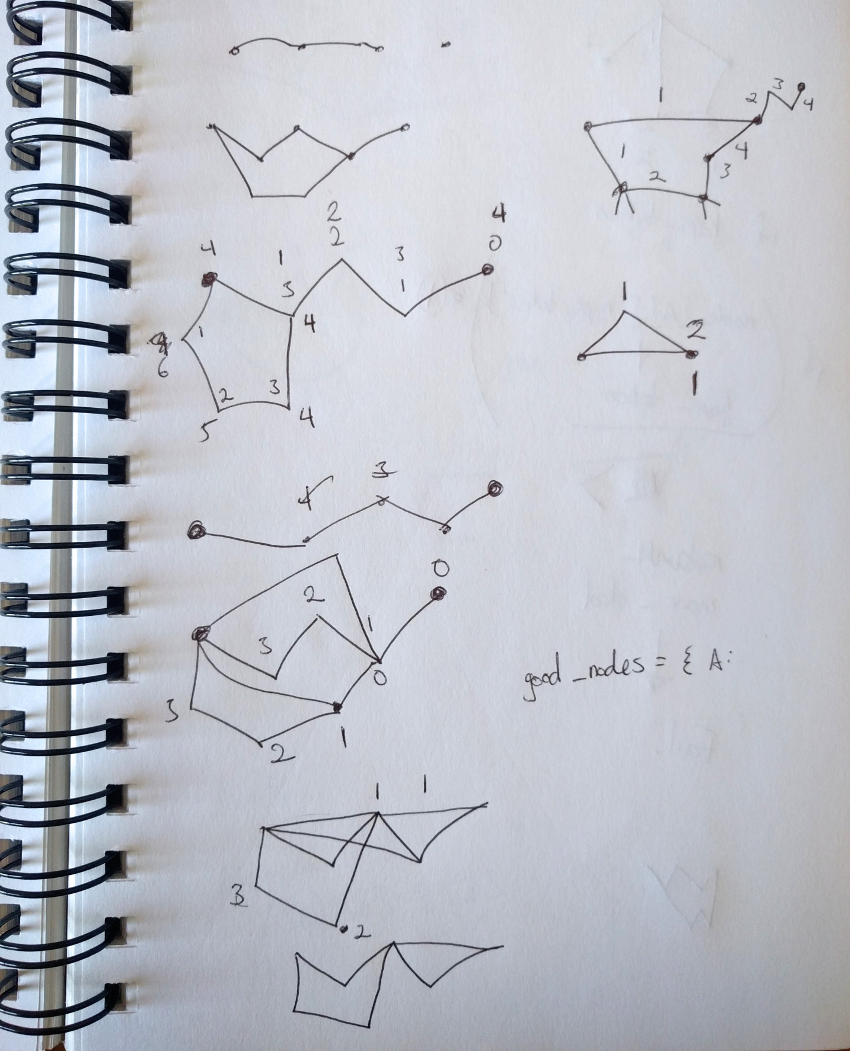
Sketches of networks (click for enlarged view)
Some Ideas for Fixing This
With computers, there are really only a few ways to make something faster:
-
Change your hardware to make it faster.
We briefly considered this approach, but realized that it would create an ongoing expense that we could not justify. It felt wrong to simply throw money at this problem without first trying every other solution in the book.
-
Cache your data in memory so that your lookups are faster.
This can be a clever way to fix a problem, because instead of querying that table of 25 million citations on disk, which is slow, you can instead query it in memory, which is fast.
We considered this solution as well, but the problem with this solution is that it creates an object in memory that has a number of bad characteristics. First, you have to remember to keep it up to date at all times. This is hard and would create very difficult bugs. Second, if we put the entire citation network in memory, well, it'd be in memory, taking up space. With memory, space is money, and you don't permanently occupy it unless you absolutely must.
-
Pre-calculate every answer to every question.
For example, instead of generating a network when a user asks us to, we could generate all of the networks in advance, and then they'd all be ready to go when a user requested them.
This can be a really great solution, and it's how a lot of really fast things work (for example, many fast things at Google work this way). But for this project, it wouldn't work because we have thousands of Supreme Court cases, any of which a user could attempt to connect to any other. That'd make millions of possible networks, and pre-computing all of them would be a cure that's worse than the disease.
-
Find a totally new approach to the problem.
One new approach to this problem would be to move our data out of the traditional two-column, Excel-style storage in our database. Instead of having a big table listing all of the cases and what they cite, instead, what if we store it in a database that treats cases as nodes in a network, and citations as links between nodes? Such databases are used by companies like Twitter and LinkedIn to say "Mike (a node) is connected (a link) to Brian (another node) by 3 degrees", and they'd probably solve our performance problems.
The problem with these kinds of databases, however, is similar to that of storing the entire citation table in memory. If we took this approach, we'd have to keep the citation network up to date at all times. That's hard. It also means adding another database to our system (a so-called "graph database"), and doing that is complicated.
For these reasons, we opted out of this solution, but a volunteer is presently researching it. Perhaps we'll use this solution in v2.
-
Change your software to make it faster.
Ultimately, this was what did the trick.
Making the Software Faster
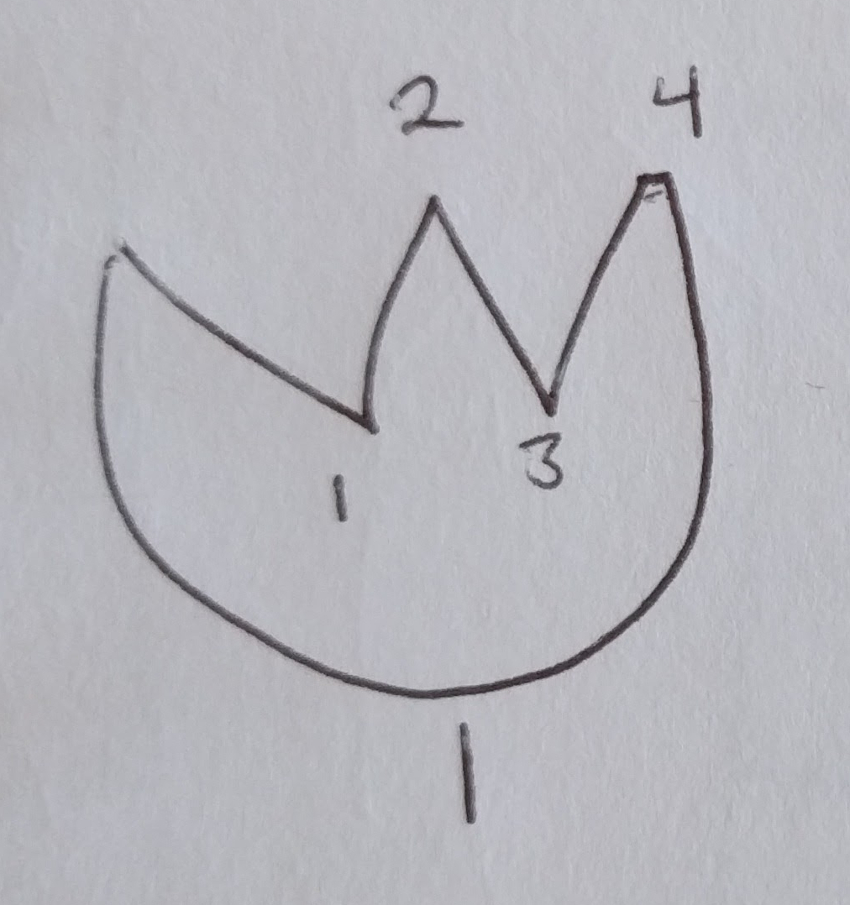
A tulip-shaped sketch (click for enlarged view)
It turns out that there were a number of ways to make the software faster, but we needed a couple constraints to make them work. First, we had an insight that some of the graphs we were making had hundreds of cases. This made them difficult to read and mostly useless. Was there a way that we could put a cap on the number of opinions in a network?
Second, we had an insight that networks with lots of hops between cases were more difficult to understand than ones with fewer hops. This was because more hops spread the network wider and wider, making it less and less concise. Was there a way we could count the number of hops between the newest and oldest case to limit it to a certain number of hops?
As you may suspect, the answer to both of these questions was yes. By limiting the number of cases in a visualization and by limiting the number of hops between cases, we were able to reduce the generation time of a visualization from as much as ten minutes to less than five seconds.
To make such a drastic change took some experimentation and research, and the sketches you see in this post were a big part of that:
- How do you avoid going in circles while working your way through a network?
- Sometimes you can arrive at a case via multiple different paths from the starting case. When that happens, how do you make sure that you never count a case twice, and more importantly, that you never traverse its citations (all 30 of them) twice?
- How do you keep track of the shortest number of hops a case has from the starting point, when sometimes you might find it via two different paths?
- How do you keep track of the number of good cases (that are close enough to the starting point) and bad cases (that are too far out) in your network?
All of these questions had to be answered while working on this, and it took some trial and error to make it happen. In the end, the key was the distinction between "breadth-first" and "depth-first" traversal of the network.
Breadth vs. Depth --- Not Just a Question for Your Résumé
Earlier, I explained a technique to traverse the network where you'd find the cases cited by the first case and for each of those you'd look up all of the opinions they cited and identify all the cases they cited, and so forth. This is called a breadth-first traversal, beacuse you expand outwards in hops of 30× at a time, only going out another hop once the current hop is complete --- You're looking at the full breadth of the network before you make your next hop.
Here's a little art that attempts to describe this as we go from opinion A to opinion K, with numbers representing the order that we take the hops:
A
│
├-1-> B
│     ├-6-> G -8-> I
|     └-7-> H -9-> J -10-> K
├-2-> C
├-3-> D
├-4-> E
└-5-> F
You can see that with this approach, it takes ten hops before we get to K, and this is in a very small network where A only has five children and G, H, and J only have one.
By contrast, in a depth-first algorithm you always go all the way from your starting point (A)to your end point (K)as quickly as possible, preferring to hop to the next opinion rather than to spread out widely:
A
│
├-1-> B
│     ├-2-> G -3-> H
|     └-4-> I -5-> J -6-> K
├-7-> C
├-8-> D
├-9-> E
└-10->F
A huge advantage of doing the depth-first approach is that you can keep track of how many good nodes you've visited as you go. For example, in our networks, the user selects two opinions at the outset, for the starting and ending points. In the example above, these are nodes A and K. We only care about nodes that eventually find their way to the starting point (K).
So if you start at A and then get to a node where you can't get to K, then that last node is a dead end, and doesn't get included in our network. Above, nodes C, D, E, F, G and H have no route to K. These would be excluded from the final network.
This is sometimes easier to understand by contrasting a breadth-first traversal. In a breadth-first traversal, you only know if there's a route to K at the very end, when you make your final hop. By then you've traversed the entire network. Since we established the constraint that a network can only contain so many opinions and still be useful, it's important to start counting the number of nodes in your network as soon as possible. That way, you can stop when you've reached your maximum number of nodes. When you traverse depth-first, you can accomplish this, but when you traverse breadth-first, you only know at the very end, once you've looked at every single node.
The second big constraint that we established was the maximum number of hops to take between A and K and luckily you can count these hops in either a breadth-first or depth-first approach. The only difficulty that arises in a depth-first approach is that you'll often find a shorter route than one the first one you attempted.
Consider:
A
│
├-1--▶ B -2--▶ D ---3---┐
|                       ▼
├-4--▶ C ------5------▶ E
|                       ▲
└-----------6-----------┘
A cites B, C, and E. B cites D. A, C and D all cite E.
In this network, as we do a depth-first traversal from A to E, the first route we take (A to B to D to E) requires three hops but the second route from A to C to E only requires two (A to C to E). The third route only requires one (A to E)!
For this reason, we must keep track of the shortest route from the starting node to every node in the network, and if we find a shorter route than one we previously took, we can reconsider all the nodes below the one with the newly found route. This gets complicated, but is entirely doable.
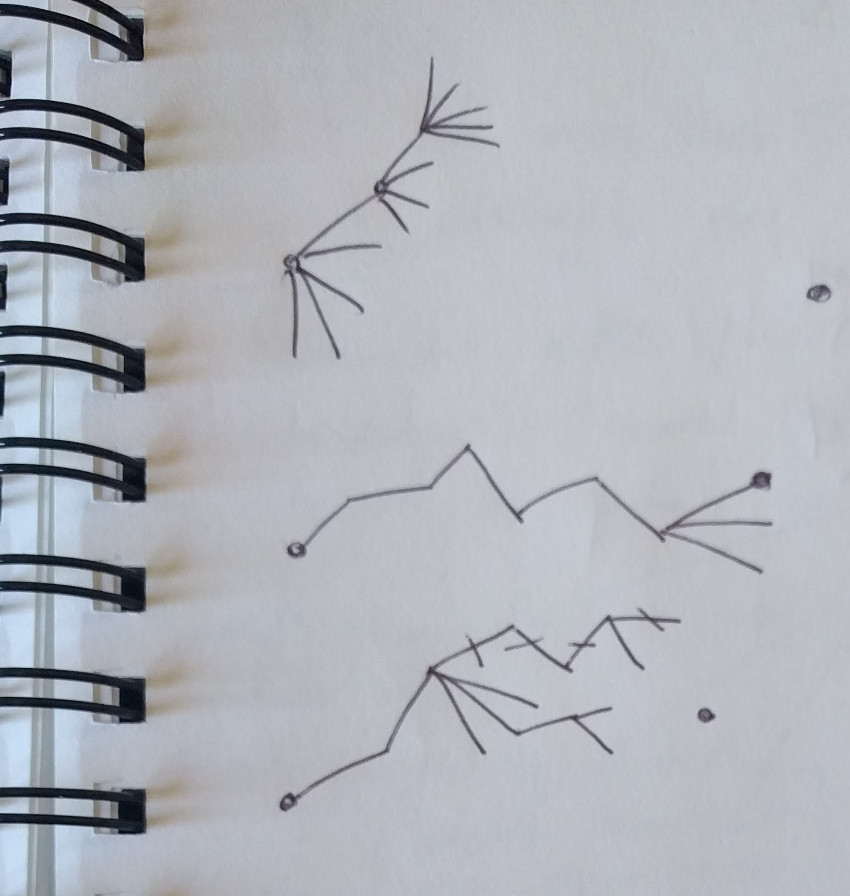
A sketch of networks with tendrils (click for enlarged view)
We Did It
As I mentioned above, getting the networks to where they are today took a lot of experimentation and research. We had to consider different approaches to fixing the performance problem and we had to implement more than a few of them before we knew what worked. We had to switch our code from breadth-first to depth-first, and we had to stamp out all manner of bugs like circular networks, newly found shortest paths, and the like.
It's been a steep learning curve but a rewarding one, and we think the final results were worth it. With our new tool, you can generate network graphs in seconds, not minutes, and you can quickly examine the relationships between Supreme Court cases.
We hope this post has been informative and that you'll check out the tool!
